
Equilibrium in Economics: How a Supply and Demand Graph Dot Explains Producer and Consumer Surplus
This video explores equilibrium–the point on a supply and demand graph where the supply curve and the demand curve intersect. It’s graphically simple, but it has deep lessons to teach about markets. At the equilibrium price and quantity, there’s neither shortage nor surplus of goods. At any higher or lower price or quantity, consumers and producers have incentives to change their behavior. But at the equilibrium gains from trade are maximized (the sum of producer surplus and consumer surplus). Absent an external force, the market is stable and balanced. The equilibrium point also separates the demand curve into two parts: buyers (who value the good at more than the equilibrium price) and non-buyers (who are not willing to pay as much as the equilibrium price). Likewise, it separates the supply curve into sellers and non-sellers based on their costs of production. LEARNERS: Test your knowledge of this topic with a set of practice questions: https://mru.io/cir TEACHERS: This topic is covered in MRU’s free Supply, Demand, and Equilibrium Unit Plan–7 days of lesson plans including videos, interactive tools, and classroom activities. These resources are always available to teachers for FREE at MRU.org: https://mru.io/l64
Suggested videos

Introduction to Economics | Marginal Revolution University (MRU)
Marginal Revolution University · 3:32
Comparative Advantage
Marginal Revolution University · 7:15
Growth Rates Are Crucial
Marginal Revolution University · 6:22
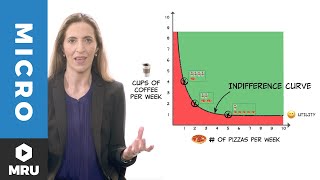
Indifference Curves
Marginal Revolution University · 8:28

Introduction to Consumer Choice
Marginal Revolution University · 4:42
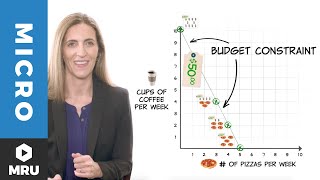
Budget Constraints
Marginal Revolution University · 6:46

Purchasing Power Parity: When in India, Get a Haircut
Marginal Revolution University · 4:28

What is Gross Domestic Product (GDP)?
Marginal Revolution University · 4:36