
Fundamentals of Exploratory Data Analysis and Visualization for Biblical Data Insights
📓 Free Jupyter notebook for this lesson: https://www.mathewkanalytics.com/lessons/data-mining/005-exploratory-data-analysis-and-visualization-basics/ ☕ Support the channel: https://buymeacoffee.com/mathewkanalytics Learn beginner data mining techniques in Python with this step-by-step tutorial. Discover how to load, clean, and visualize popular data sets such as Iris, Titanic, and Groceries. This lesson covers essential skills like handling missing values, generating descriptive statistics, and creating informative plots to help you understand and analyze data effectively. Follow along as we explore different data types, uncover patterns, and prepare data for more advanced analysis. By the end of this video, you will have a solid foundation in basic data mining workflows and be ready to apply these techniques to your own projects. 00:00 Introduction and lesson overview 00:23 Setting up the Python environment 01:11 Loading the Iris data set 01:49 Exploring Iris data structure 02:16 Identifying columns and features 02:55 Checking for missing values 03:21 Generating descriptive statistics 04:24 Visualizing data with histograms 04:55 Creating scatter plots for relationships 05:47 Introducing the Titanic data set 06:33 Previewing Titanic data 07:33 Analyzing gender distribution 08:08 Calculating survival rates 08:53 Visualizing survival by ticket class 09:58 Loading the Groceries data set 10:23 Preparing transaction baskets 11:23 Exploring association rules 12:20 Recap and next steps 12:44 Practice and further learning #Python #DataScience #BeginnerTutorial
Suggested videos

Understanding Time Series: Key Concepts and Practical Applications in Data Analysis
Mathew K Analytics · 15:01
Karan Dodia - Rapid Exploration and Visualization of Large Datasets
PyData · 26:08
End-to-End Supply Chain Analytics Project_training
Mathew K Analytics · 22:27

Seven Stages of Predictive Analytics Implementation | by: Christian Levida
OM3B Predictive Analytics · 2:18

Comprehensive Guide to Building a Customer Churn Prediction Model from Start to Finish
Mathew K Analytics · 20:25

'Exploratory Data Analysis' on dataset ‘SampleSuperstore’||GRIP-MAR21||TSF||Python||ML
Pseudo Coders · 4:30

Understanding Customer Churn: A Step-by-Step Guide to Predictive Analysis
Mathew K Analytics · 19:10
How to view the uploaded data in Tableau | Tableau interface | Data
codingdidi · 1:26
Understanding Python Dictionaries: Key Concepts and Practical Applications
Mathew K Analytics · 19:53
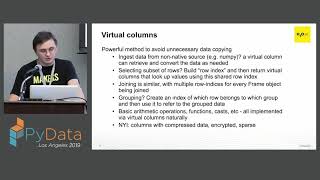
Ana Castro Salazar, Pasha Stetsenko: Intro to Data Analysis with Python Data-table | PyData LA 2019
PyData · 1:15:58
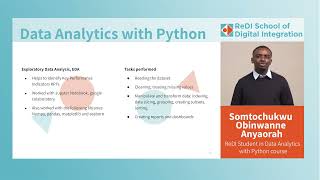
Data Analytics with Python presented by Somtochukwu Obinwanne Anyaorah
ReDI School of Digital Integration · 2:44

Machine Learning for Beginners in Python | Data Analytics #25
Mathew K Analytics · 10:22