
The 6 Levels of Retirement Income: Where Are You?
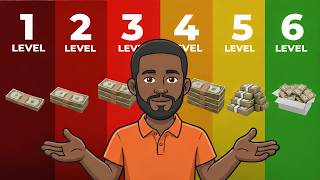
Gary and Lorraine are 67, retired in Dayton, Ohio. Two Social Security checks, Gary's pension from the gas company and a little from their IRA: $78,000 a year. Their neighbor Phil says anyone retired on less than $100,000 is just getting by. Otis checks the Census. In 2024 there were 37.6 million households run by someone 65 or older, with a median income of $59,648. Otis cuts them into six levels of income, from under $25,000 to over $150,000, and six in ten live on less than $75,000. Gary and Lorraine are on level 4. Then the part almost nobody reads: Gary plans to take his pension as a single life. If he dies first, Lorraine keeps the larger Social Security check, loses the pension, and drops to level 2, about $16,700 a year short of living the same way. For $180 a month, the joint and survivor option keeps her on level 3. Plus the move on each level (the help most people never claim, timing Social Security, the $32,000 line, required withdrawals at 73 or 75, Medicare IRMAA), why one person needs about three-quarters of what a couple needs, and five things people say about retirement income. Chapters 0:00 Which level are you on? 0:34 Gary and Lorraine 1:15 How Otis built the levels 2:05 Levels 1 and 2 3:06 Level 3 4:12 Level 4 5:06 Levels 5 and 6 6:01 The level after one of them 7:16 One signature 8:34 What people say about retirement income 9:13 The whole list 10:02 Otis's Rule #38 Numbers used in this video • Households headed by someone 65 or older, 2024: 37.6 million; median income $59,648 (US Census, ACS 2024 1-year, tables B19037 and B19049) • The six levels, share of older households: under $25,000 21% (7.9 million), $25,000–50,000 22% (8.2 million), $50,000–75,000 17%, $75,000–100,000 12% (4.6 million), $100,000–150,000 14% (5.2 million), over $150,000 14% (about one in seven); below $75,000: six in ten; below $100,000: seven in ten (Census B19037; Otis's math) • Average retired-worker Social Security check after the 3.6% COLA for 2027: $2,170 a month ($26,040 a year); a couple where both receive benefits: $3,355 a month ($40,260 a year) (SSA 2027 COLA fact sheet) • Delayed retirement credits: 8% a year past full retirement age, up to 70 (SSA) • A surviving spouse keeps the larger of the two Social Security checks; the smaller one stops (SSA, Survivors benefits) • Social Security becomes partly taxable for a couple when other income plus half the benefits passes $32,000; the thresholds were set in 1984 and 1993 and are not indexed for inflation (IRS Pub 915; Congressional Research Service) • Qualified Roth IRA withdrawals don't count toward that line; traditional IRA withdrawals do (IRS Pub 590-B) • Gary and Lorraine (hypothetical): $24,000 of pension and IRA money + $27,000 (half of Social Security) = $51,000; $11,950 of Social Security taxable; taxable income $35,950, below $47,500 of deductions for a couple 65+ in 2026 → $0 federal income tax (IRS Pub 915 worksheet; Rev. Proc. 2025-32; IRS senior deduction; Otis's math) • Required minimum distributions start at 73, or 75 for anyone born in 1960 or later (IRS; SECURE 2.0) • The senior deduction phases out above $150,000 of modified AGI for a couple; Medicare IRMAA 2026 raises premiums for couples above $218,000 (IRS; CMS) • HHS poverty guidelines 2026: $15,960 for one person, $21,640 for two, so one person needs about 74% of what a couple needs (Federal Register; HHS ASPE) • Lorraine alone on a single-life pension: $2,900 + $500 = $3,400 a month, $40,800 a year; to live the same way she'd need about $57,500 (0.7375 × $78,000); about $16,700 a year short, about $167,000 over ten years (Otis's math) • Joint and 100% survivor option: $1,320 a month instead of $1,500, $180 a month or $2,160 a year less; the couple still has $75,840; Lorraine alone would have $56,640 (Otis's math; Gary's plan numbers are hypothetical) • For most company pensions the survivor annuity is the default; choosing a single life needs the spouse's written consent, witnessed by a notary or a plan official; plans must also offer a 50% or 75% survivor option (IRC §417; IRS; US Department of Labor, EBSA) Sources: US Census (ACS 2024 1-year, B19037, B19049); SSA (2027 COLA fact sheet; Delayed retirement credits; Survivors benefits); IRS (Pub 915; Pub 590-B; Rev. Proc. 2025-32; Seniors deduction; Required minimum distributions; Qualified joint and survivor annuity); Congressional Research Service (RL32552); CMS; HHS (2026 poverty guidelines, Federal Register); US Department of Labor (EBSA); Cornell LII (26 U.S.C. §417). This video is general education, not financial or tax advice. Gary and Lorraine are a hypothetical example, and Gary's pension numbers are illustrative. Check your own plan's numbers before you sign anything.
Suggested videos

Six Levels of Retirement Income: The 2026 Numbers
Uncle John Financial · 20:48

Why Downsizing After 60 Pays Less Than You Think
Otis Does the Math · 11:14

The 6 Levels of Retirement Wealth — Where Do You Fall?
Kevin Lum, CFP® · 19:52
5 Bills You Stop Paying at 65? Only 1 Is Real
Otis Does the Math · 10:38

The Six Levels of INCOME in Retirement
Holy Schmidt! · 16:14

The $1 That Costs Early Retirees $24,792
Otis Does the Math · 10:31

6 Levels of Retirement Wealth - Which One Are You In?
Erin Talks Money | Erin Moriarity · 20:45

Your State May Pay Your $2,400 Medicare Bill
Otis Does the Math · 10:23
The Medicare Mistake That Costs You for Life (COBRA Doesn't Count)
Otis Does the Math · 10:09

The 6 Levels of Retirement Wealth — Which Level Are You Actually At?
Rob Gariano, CFP® · 21:20

Popular Culture and Mathematics Education (Otis Chen)
Eddie Woo · 6:11
The 6 Levels of Income in Retirement — Which One Are You In? (2026)
The Regular Investor · 18:47