
3 Modern Excel Dashboards Your Boss Has Never Seen
Excel's new interactive canvas builds Excel dashboards with filters, sliders and a play button. 👉 Copilot course insider pre-sale: https://www.xelplus.com/course/copilot/?utm_source=yt-video&utm_medium=vid-description&utm_campaign=copilot&utm_content=copilot-interactive-canvas With Excel's new interactive canvas skill powered by Copilot in Excel, I describe the report I want, and Copilot builds it on its own sheet, connected to my Excel data. First, a travel expense report with KPI cards, charts, filters and commentary that updates. Then I make it interactive: click a bar to cross-filter, add a slider for a minimum amount, and click a number to drill into the details. Change the data and the report updates. No refresh needed. Then I combine four sheets into a project status report for the steering committee, with a Gantt chart, RAG status, risk matrix and budget versus actual. A play button replays how the project unfolded. And to finish, a race chart of my top 10 customers. Copilot at Work covers Copilot in Excel first, then the rest of Microsoft 365. You'll learn how to train Copilot on your own process with skills, so you don't type the same prompt every month. Join the insider list to hear first when it opens: https://www.xelplus.com/course/copilot/?utm_source=yt-video&utm_medium=vid-description&utm_campaign=copilot&utm_content=copilot-interactive-canvas-body ✅ Good to know: Interactive canvas is rolling out in preview, so you may not see it yet. You need Copilot in Excel. The canvas sits on its own sheet and works like a small web page that reads your data. You can't see the formulas or right-click to edit. Ask Copilot to explain a number, change the design or add a calculation sheet. The skill is under Manage plugins and skills. If it's off, @mention it in your prompt. ⏱️ Chapters: 00:00 Excel dashboards with a play button 00:50 Travel expense data and the prompt 01:23 Turn on the interactive canvas skill 01:46 The finished report: KPIs, charts, commentary 02:36 Filter by month 02:59 How the canvas works 03:26 Ask Copilot how a number is calculated 03:45 Limits: no right-click editing 04:00 Add cross-filtering and a slider 04:25 Test the minimum amount slider 04:54 Hover and cross-filter by clicking a bar 05:42 Drill down to the details behind a number 06:26 Does it update when the data changes? 07:02 Play button: a tour of the findings 07:34 Combine several sheets into a project report 08:56 Interactive Gantt chart 09:44 RAG status, risk matrix and budget vs actual 10:13 Replay the project history 10:59 Bonus: race chart of the top 10 customers ➡️ Join this channel: https://www.youtube.com/channel/UCJtUOos_MwJa_Ewii-R3cJA/join 👉 Get one practical Excel tip each week in our newsletter: https://link.xelplus.com/yt-d-newsletter 🚩 Connect with us: Instagram: https://www.instagram.com/lgharani LinkedIn: https://www.linkedin.com/in/leilagharani #excel #copilot #microsoft365
Suggested videos

Power Query for Beginners: Automate Your Excel Work in 25 Mins
Leila Gharani · 27:01

Stop Writing Huge Excel Formulas. (Use ONE DOT Instead)
Leila Gharani · 10:24
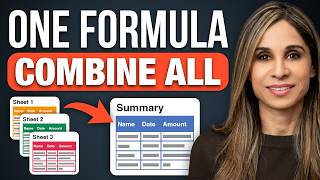
Stop Copying Data Between Excel Sheets! (Do This Instead)
Leila Gharani · 10:31

How to Use XLOOKUP in Excel (5 Practical Examples)
Leila Gharani · 13:34

8 Excel Features Every Office Worker Should Know
Leila Gharani · 11:48

The Only VLOOKUP Guide You’ll Ever Need. (No More Errors)
Leila Gharani · 15:15

Stop OneDrive From Hijacking Your Desktop and Documents
Leila Gharani · 11:58
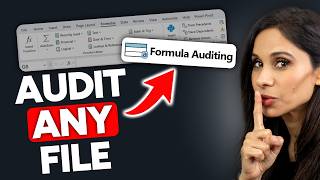
8 Hidden Excel Tools to Understand Any Spreadsheet
Leila Gharani · 11:23