
Correlation and Heatmaps in Pandas: Find What Really Drives Your Data | Pandas Course #43
What makes a car thirsty? Its weight, its engine size, its horsepower? They all seem to matter, but which matters most, and do they just repeat each other? In this 24-minute lesson you'll learn to: ✅ Measure how two columns move together with corr() ✅ Build a correlation matrix for a whole table ✅ Draw it as a clear, honest heatmap ✅ Rank the strongest pairs and spot redundant columns ✅ Choose Pearson or Spearman, and avoid the classic traps 📊 Datasets: cars, Titanic 🛠️ Mini-project: what really drives fuel economy? This is Lesson 43 of 65 in the free Pandas Full Course: from your first DataFrame to real business and machine-learning projects. Pandas is the tool data analysts use every day, and every lesson uses real data, so you finish with skills you can show an employer. 📓 Free notebooks, datasets and 500+ lessons (no sign-up): https://www.mathewkanalytics.com/?utm_source=youtube&utm_medium=description ⏱️ Chapters 0:00 Introduction 1:04 Warm-up: one Seaborn scatter 2:26 Measure two columns with one number 5:10 Build a correlation matrix 7:23 Turn the matrix into a heatmap 10:25 Rank the strongest pairs 12:56 Pearson, Spearman and the classic traps 15:54 Correlation with a target: Titanic survival 18:43 Mini-project: what really drives fuel economy? 22:43 Recap 23:23 Challenges 23:45 What's next ⏮️ Previous: Matplotlib & Seaborn: https://youtu.be/2LHJDzF8gc4 ▶️ Next: Plotly & Pandas: https://youtu.be/0e-qESPlh3k 📚 Full Pandas course playlist: https://www.youtube.com/playlist?list=PLcjVCNrv7tsA 💬 Stuck on a step? Ask in the comments and I'll help. #Pandas #Python #DataAnalysis
Suggested videos

Understanding Time Series: Key Concepts and Practical Applications in Data Analysis
Mathew K Analytics · 15:01
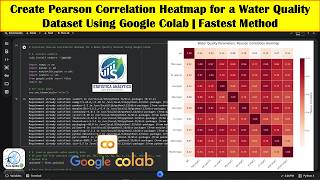
Create Pearson Correlation Heatmap for a Water Quality Dataset Using Google Colab | Fastest Method
Terra Spatial · 18:26
End-to-End Supply Chain Analytics Project_training
Mathew K Analytics · 22:27

Python Pandas & EDA: The Guide for Aspiring Data Analysts
NetRVA Academy · 27:34
Pandas Full Course Part 3 (5 Hours): groupby, Pivot Tables, Merging & Time Series in Python
Mathew K Analytics · 5:21:39

How to Create a Correlation Matrix in Excel [Updated 2026]
Tutorials With Noel · 3:37

Comprehensive Guide to Building a Customer Churn Prediction Model from Start to Finish
Mathew K Analytics · 20:25
Python Tutorial : Data transforms, features, and targets
DataCamp · 4:04
Understanding Python Dictionaries: Key Concepts and Practical Applications
Mathew K Analytics · 19:53
Timeseries Data Visualization, Analysis, and Forecasting - Part 3: Pandas Profiling
HydroMohsen · 12:26
Fundamentals of Exploratory Data Analysis and Visualization for Biblical Data Insights
Mathew K Analytics · 13:12
Using ChatGPT to write Python Code to Analyze Chemical Data in Google Colab
Gianmarc Grazioli · 40:14