
The 6 Levels of Retirement Income — Where Do You Actually Rank?
There is a retirement income ladder in America, and almost nobody knows which rung they are standing on. At the bottom, households live on under $15,000 a year. At the top, more than $188,000. Same country, twelve times the money. Most rankings measure net worth — your house, your savings, everything you own added together. But you cannot spend a kitchen. So this one measures something different: the money that actually arrives every month, ready to be spent. Six levels. Real 2026 numbers. And one calculation almost nobody runs. In this video: – Level 1: under $25,000 a year, and why one in five older households are here – Level 2: $25,000 to $40,000 — what changes when a second income appears – Level 3: $40,000 to $60,000 — the exact middle of America, and its quiet problem – Level 4: $60,000 to $100,000 — the first level where money stops being a daily thought – Level 5: $100,000 to $188,000 — where the pot stops shrinking and starts growing – Level 6: above $188,000 — the top ten percent, and the one risk that still reaches them – The break in the ladder that sits between Level 3 and Level 4, and why it matters more than which rung you are on The calculation: the average American retiree spends $59,616 a year — $4,968 a month. Put every level against that number and the picture changes completely. The median household brings in $4,723. That is a shortfall of $245 every month, and it is not a projection. It already happened: retirees earned $57,622 last year and spent $59,616. ━━━━━━━━━━━━━━━━━━━━ 📊 RUN YOUR OWN NUMBERS Zero-Based Budget Worksheet 2026 — work out exactly what arrives and what leaves each month → https://wealthbeyond.gumroad.com/l/jtfdqs Savings Goal Calculator 2026 — what you need, and how far off it you actually are → https://wealthbeyond.gumroad.com/l/qojzm ━━━━━━━━━━━━━━━━━━━━ SOURCES United States Census Bureau — household income by age, 2024 tables Bureau of Labor Statistics — Consumer Expenditure Survey, retiree spending Social Security Administration — average retired worker benefit, 2026 after COLA All figures are current for 2026. All people shown are AI-generated and represent no real individual. This channel is for education and information only. It is not financial, tax, investment or legal advice. Everyone's situation is different — speak to a qualified professional before making decisions about your money. Stock footage: Kamran Rejniak-Choudhury, Sarowar Hussain, Orhan Pergel (Pexels) ━━━━━━━━━━━━━━━━━━━━ 🔔 New numbers every Saturday. #RetirementIncome #RetirementPlanning #PersonalFinance
Suggested videos

The 6 Levels of Retirement Income: Where Do You Rank?
Money Mike Retirement · 19:27

Same $400,000. One Ran Out at 79. The Other Lasted to 94.
WealthBeyond - Retirement Numbers · 12:44

The 6 Levels of Retirement Wealth — Where Do You Fall?
Kevin Lum, CFP® · 19:52

The 5 Levels of Retirement Spending — What Does Your Life Actually Cost?
WealthBeyond - Retirement Numbers · 11:50

The Six Levels of INCOME in Retirement
Holy Schmidt! · 16:14

5 Retirement Wealth Levels (What Your Net Worth Won't Tell You)
Veraa Invests · 36:50

The 7 Retirement Wealth Levels in America - Find Your Level
American Income with Liam and American Finance with Liam · 12:34

What Health Insurance Actually Costs Before Medicare in 2026
WealthBeyond - Retirement Numbers · 10:14

Where Does $78,000 Rank in Retirement?
Otis Does the Math · 10:34

24 Hours Is All Anyone Gets — The $21,000 Trick That Separates the Rich From the Broke
WealthBeyond - Retirement Numbers · 24:39
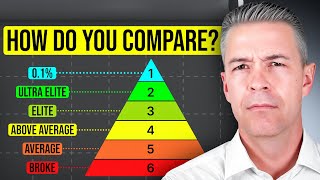
6 Levels of Retirement Spending - Which One Are You?
Cody Gunn, CFA · 11:23

Why Making $100k+ Keeps You Broke (The 6 Levels of Wealth)
WealthBeyond - Retirement Numbers · 8:24